This will be assessed in Section B of Exam 3.
The steps for a geographical enquiry:
- Suitable question for geographical enquiry
- Create a question or hypothesis to test
- Identifing a suitbale location to study
- Conducting a risk assessment at the location
- Selecting, measuring and recording data appropriate to the chosen enquiry
- Primary data is collected yourself
- Secondary data has been collected by others
- Sampling is when you don’t collect every measurement but select a small proportion as a sample. This could be random sampling (picking at random) or systematic sampling (measuring every so often).
- Selecting appropriate ways of processing and presenting fieldwork data
- Presenting the results using graphical and cartographical (mapping) techniques
- Describing, analysing and explaining fieldwork data
- Describing trends and relationships, explaining results and spotting anomalies
- Reaching conclusions
- Linking back to the question or hypothesis
- Evaluation of geographical enquiry
- If you repeated the project, what would you do differently?
Physical geography fieldwork
We went to Carding Mill Valley in Shropshire to study rivers.
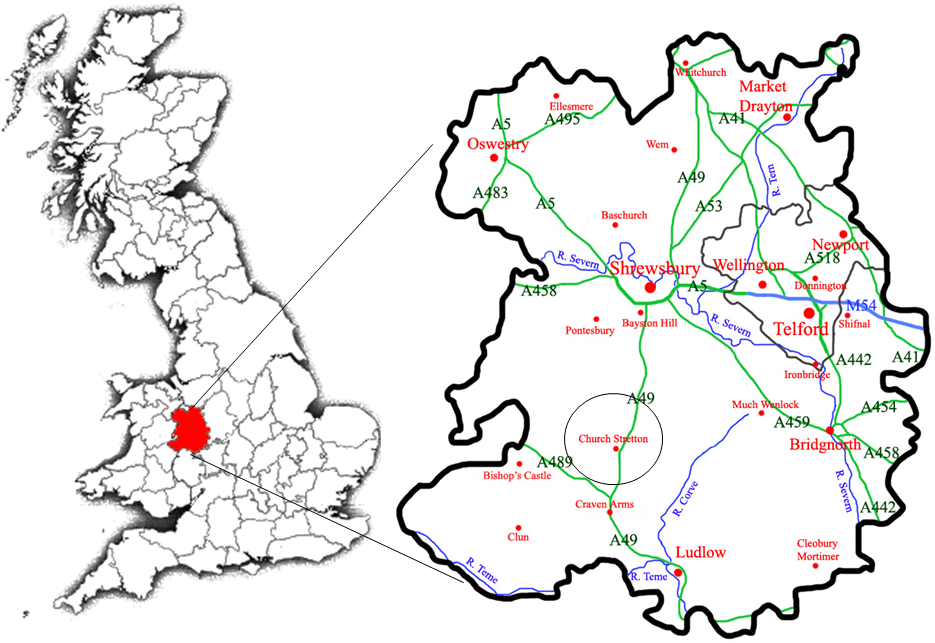
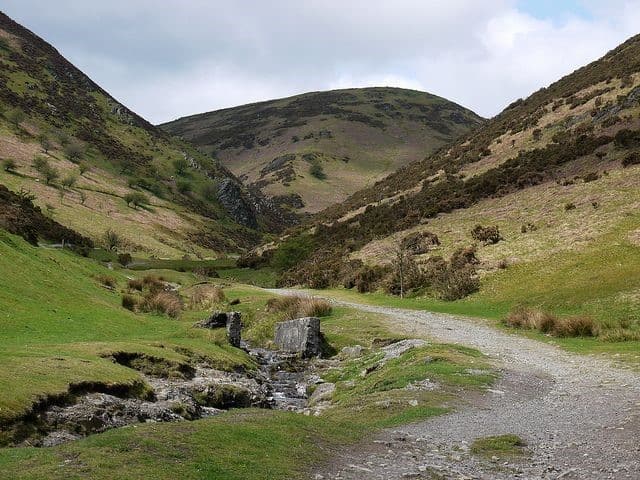
Carding Mill Valley was suitable for our fieldwork because it is close to school. The access to the river is safe with small river banks. Also, the river is shallow and not fast flowing. The land is owned by the National Trust, who give us permission to use the site.
Our question for investigation was:
“Do the changes observed in Ash Brook as you go downstream fit with Bradshaw’s Model?”
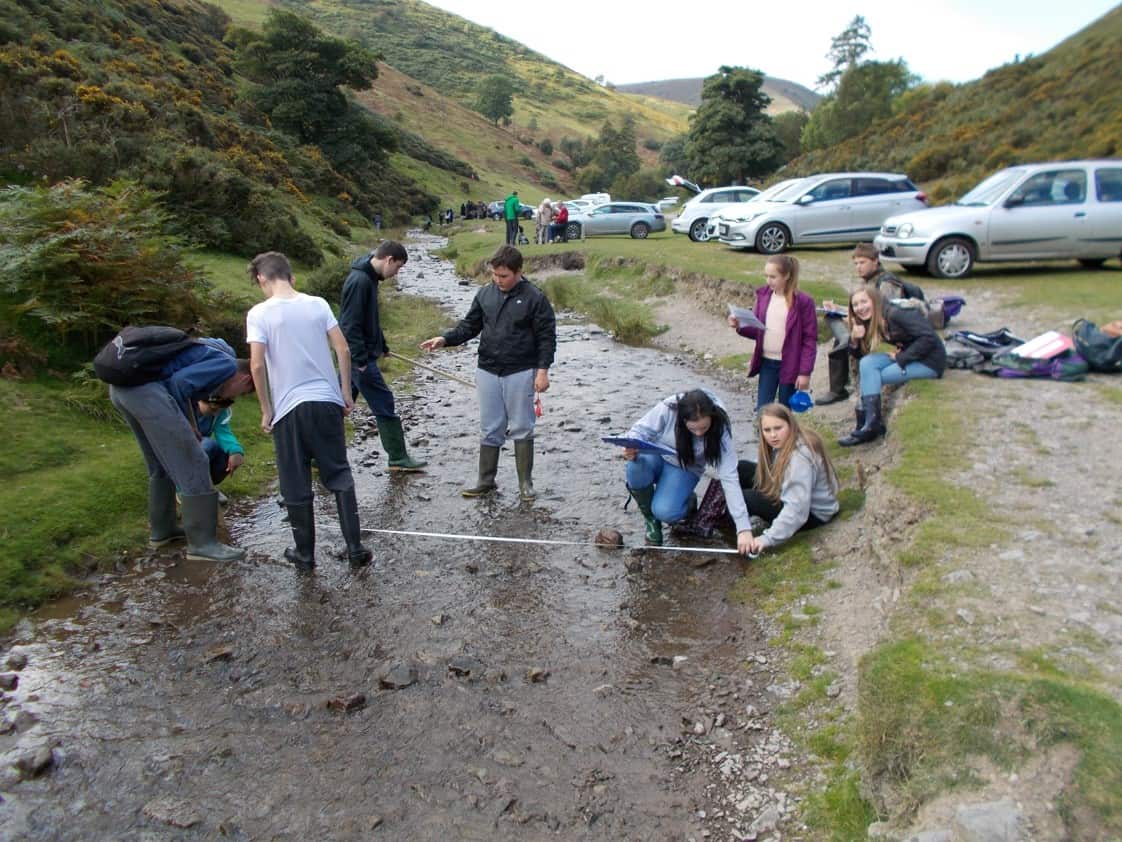
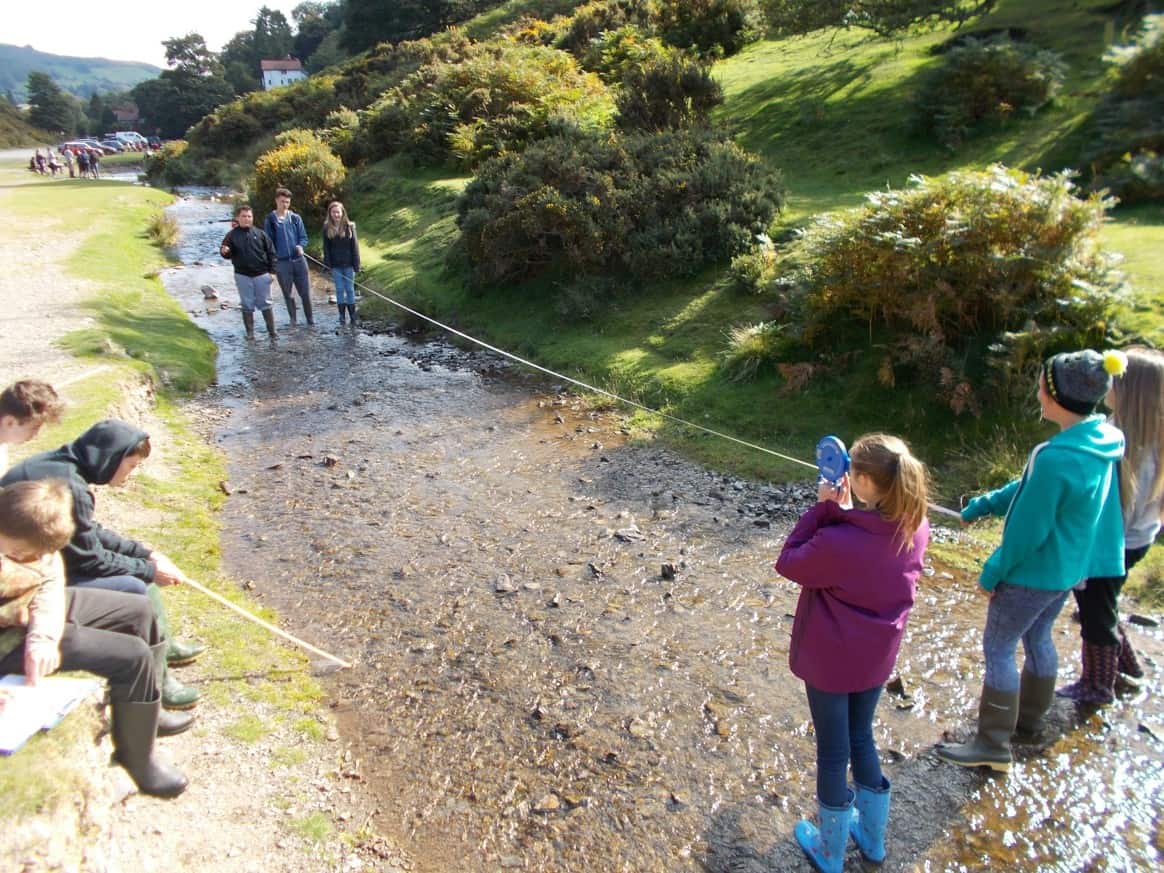
Our primary data collection included a systematic sample of river depth and bedload size and shape across the channel at different sites going downstream. We used tape measures and rulers for the width, depth and bedload size. We used a chart to judge bedload shape. We did a systematic sample of depth so that we knew the depths at regular intervals across the river and we could draw cross sections. Measuring the sizes of many pieces of bedload allowed us to calculate means or medians and interquartile ranges.
We also measured gradient and river speed over a 10m section at each location. We timed a dog biscuit with a stop watch three times to measure the speed. We used a dog biscuit because it floats just below the surface so is unaffected by wind. It is also biodegradable. We used a 10m stretch of river as it was fair test of the speed at that site and a round number to help with our calculations. We repeated the test to get an average.
Our secondary data came from Ordnance Survey maps to calculate the distances between each site and satellite images from Google or Bing.
The graphs we drew with the data collected in Carding Mill Valley included cross sections (cross profiles) of the river upstream and downstream to see if the width and depth changed. We plotted the bedload sizes as dispersion graphs or box plots. (To draw a box plot we needed to work out the median, upper and lower quartile in each sites’ data.) We drew scattergraphs of width, depth, speed or bedload shape.
Problems experienced with our data collection methods included the dog biscuit getting stuck while measuring the speed and the difficulty in placing stones into the right bedload shape category.
To investigate human and physical interactions we also looked at the impact of people on Carding Mill Valley.
Our question was:
“Is tourism having a positive or negative effect on Carding Mill Valley?”
We used primary data, like our own photographs, and secondary data from the National Trust to answer this question.
Human geography fieldwork
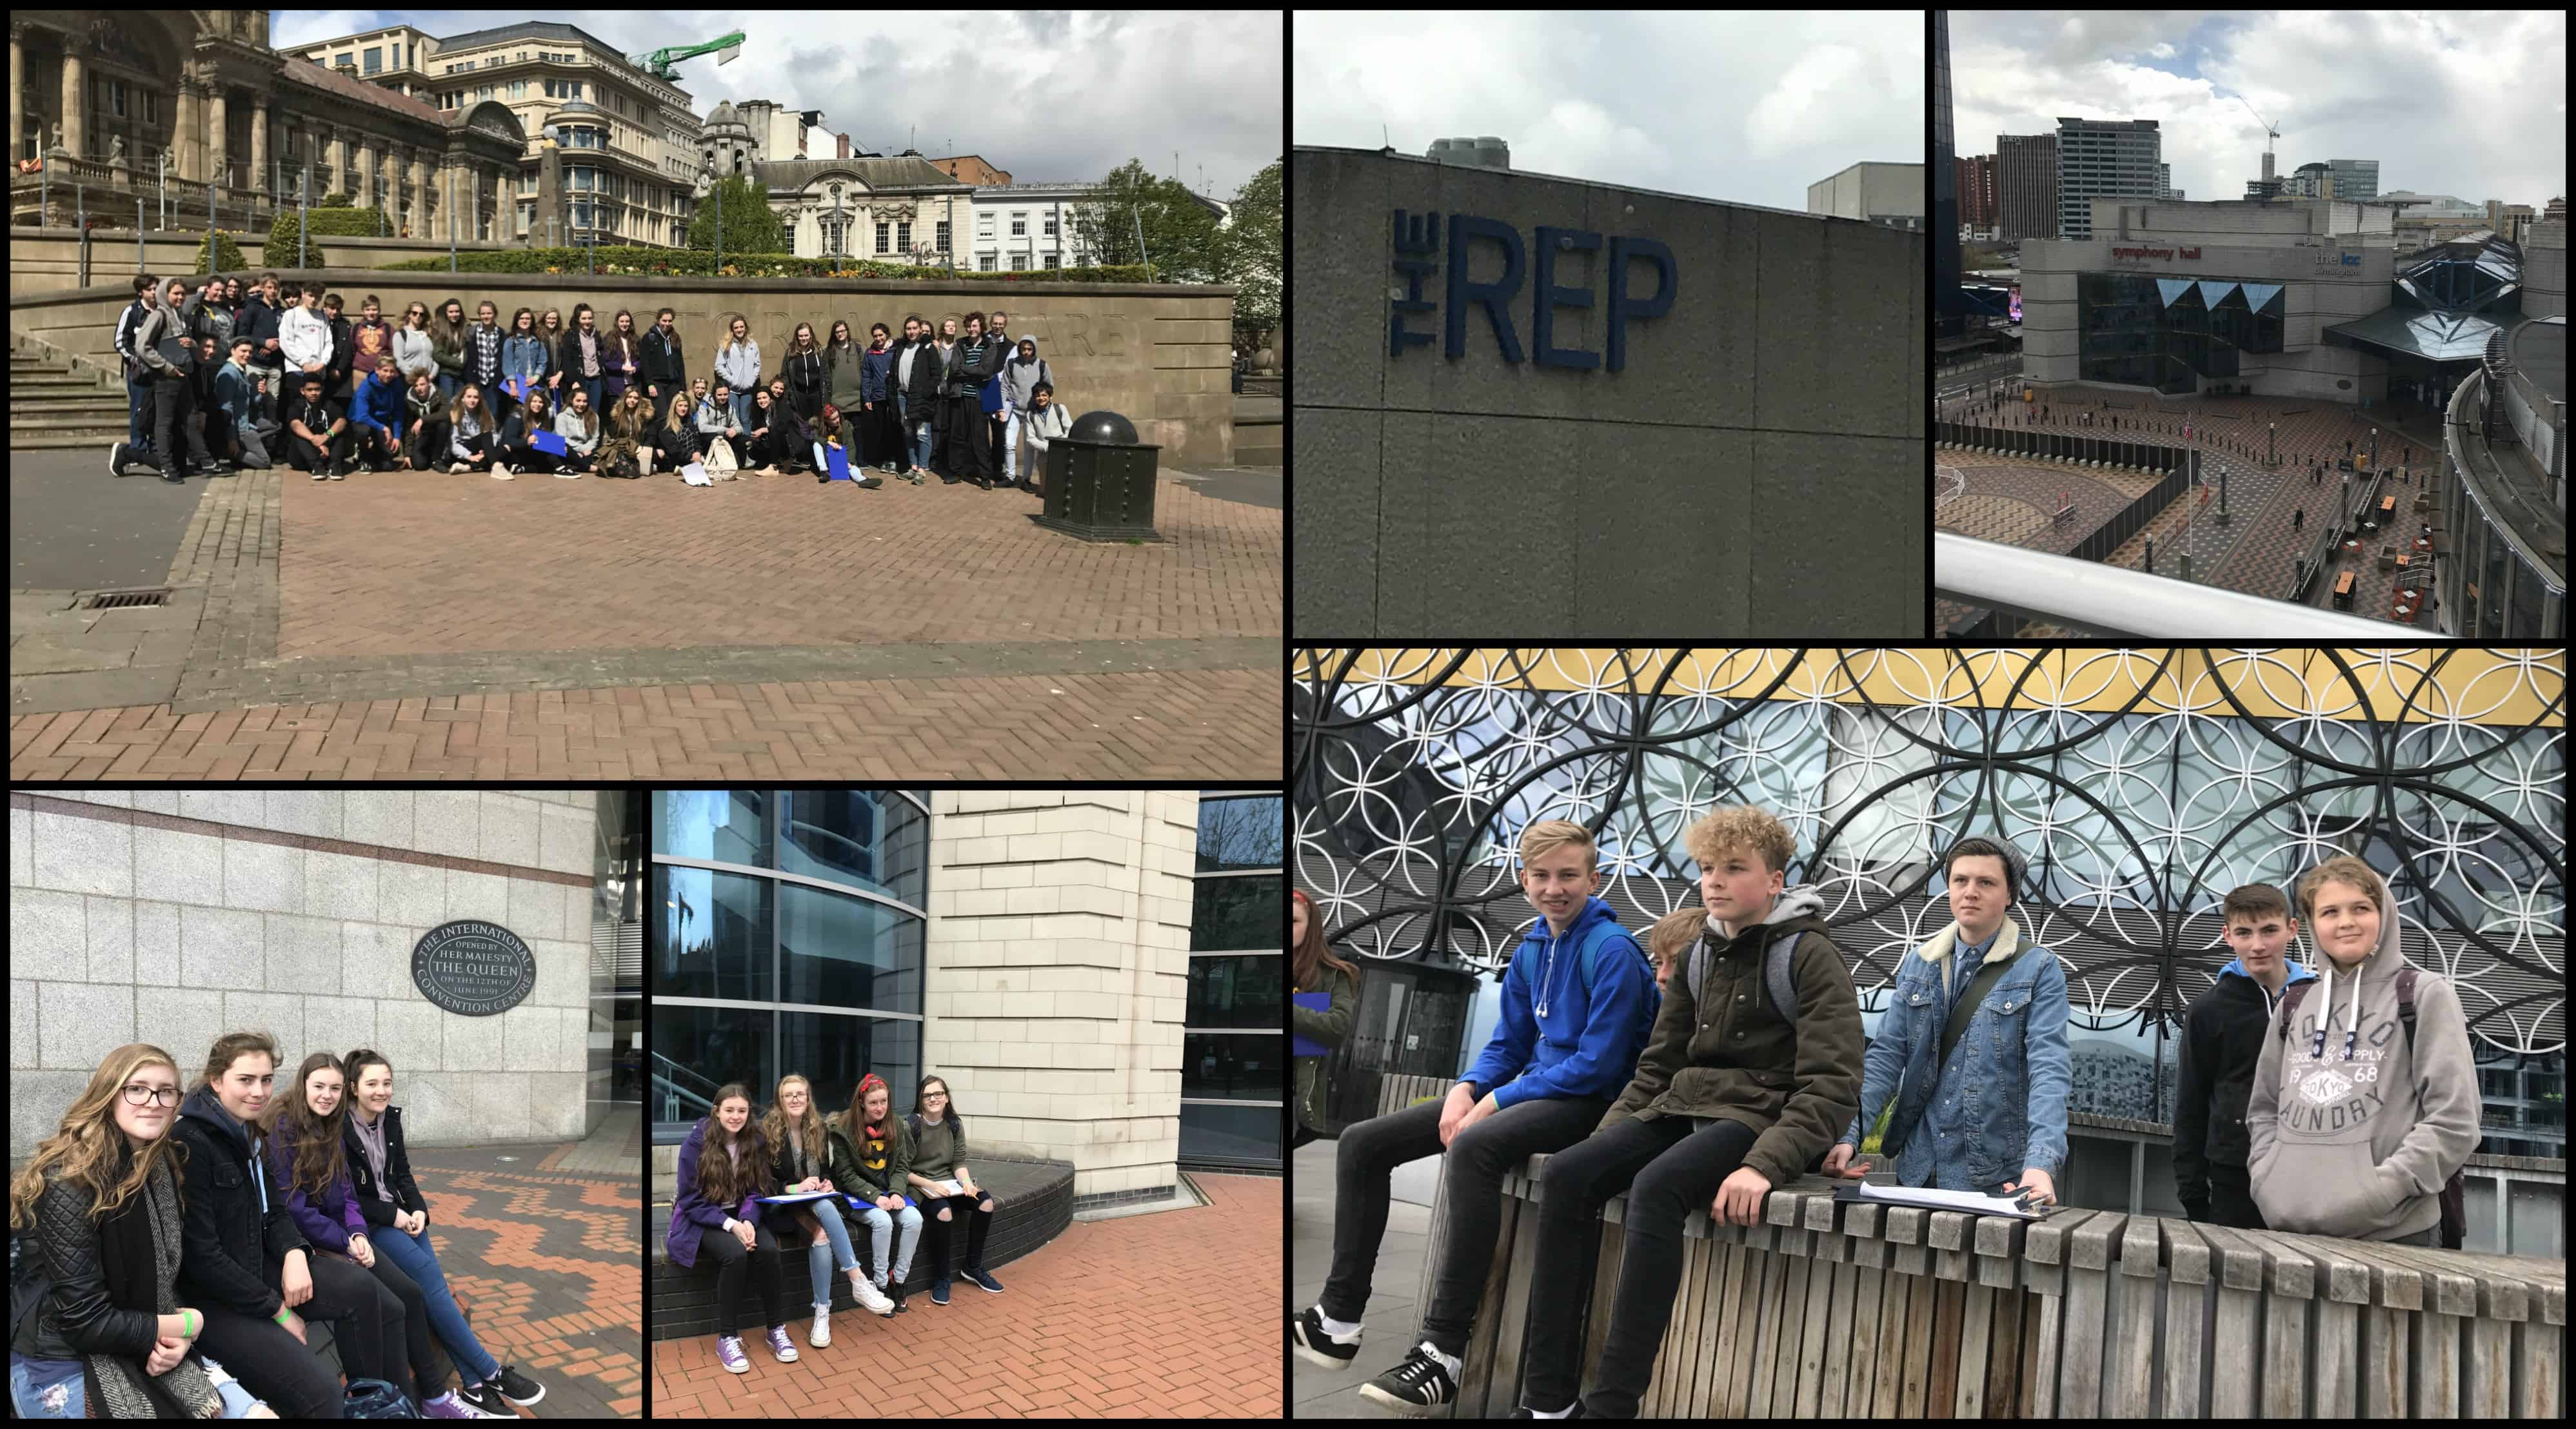
We went to Birmingham to study urban regeneration.
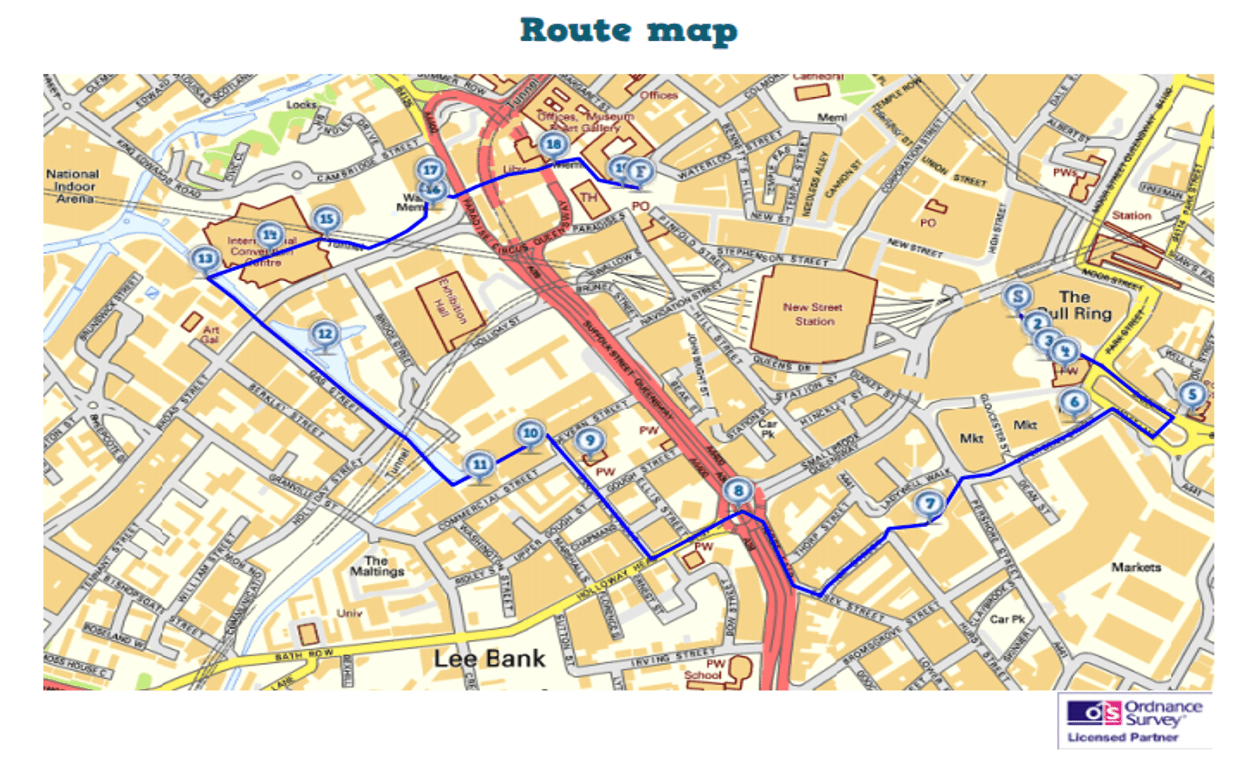 Birmingham was suitable for our fieldwork because it was a large city with a variety of areas which have experienced urban regenertion. It is also close to school for travel. Much of the city centre is pedestrianised, which makes it a safe place to walk.
Our hypothesis for investiagtion was:
“The urban regeneration of brownfield sites in Birmingham city centre has been successful”
Our primary data collection included a pedestrian count of people passing different locations, recorded in a 5 minute period. The 5 minute sample period was suitable because it allowed us to see which area was popular with workers, shoppers and visitors to Birmingham. Any shorter and someone may not have walked past in the time. Any longer and our survey would have taken too long.
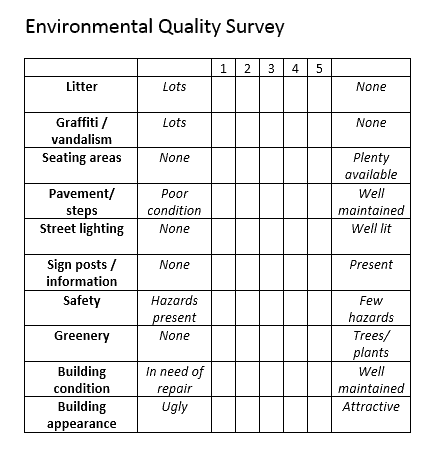
We also collect information on the environmental quality using a bi-polar survey. This type of survey allowed us to turn qualitive data (based on a persons subjective opinion) into quantative data ( a numerical score). Giving each part of Birmingham city centre a score meant we could plot results as graphs or maps.
Our secondary data came from old maps and photographs from the internet to show what the area looked like before redevelopment.
We drew flow line maps ( with arrows proportional to the number of pedestrians), isoline maps (joining places with equal numbers of pedestrians, dot maps (with more dots to represent more people) or proportional circle maps (with circles drawn to scale to show the number of pedestrians).
Problems with our data collection methods included the different opinions of the environmental quality in the bi-polar survey and the difficulty in accurately counting pedestrians.