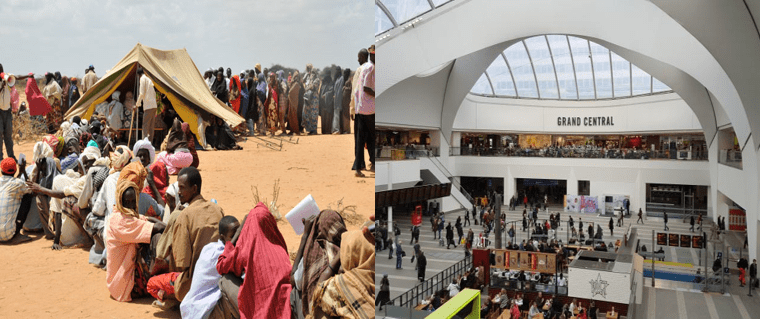
- Quality of life is a measure of people’s well being. It can be affected by economic, social, environmental and political factors. Look at the diffences between the quality of life of the people above.
- The contrasting quality of life experienced by people in different countries is known as the level of development.
- You can compare the quality of life in different countries using measures of development.
| Life expectancy | how many years on average a person would live for |
| Infant mortality | how many children die before 1st birthday per 1000 per year |
| Literacy rate | the % of the population who can read and write |
| Access to safe water | the % of the population with a clean water supply |
| Number of people per doctor | the number of people to every doctor |
| Gross Domestic Product (GDP) | the value of all the goods and services produced by a country measured in $US |
| Gross National Income (GNI) | the value of all the goods and services produced by a country and income from its overseas investments measured in $US |
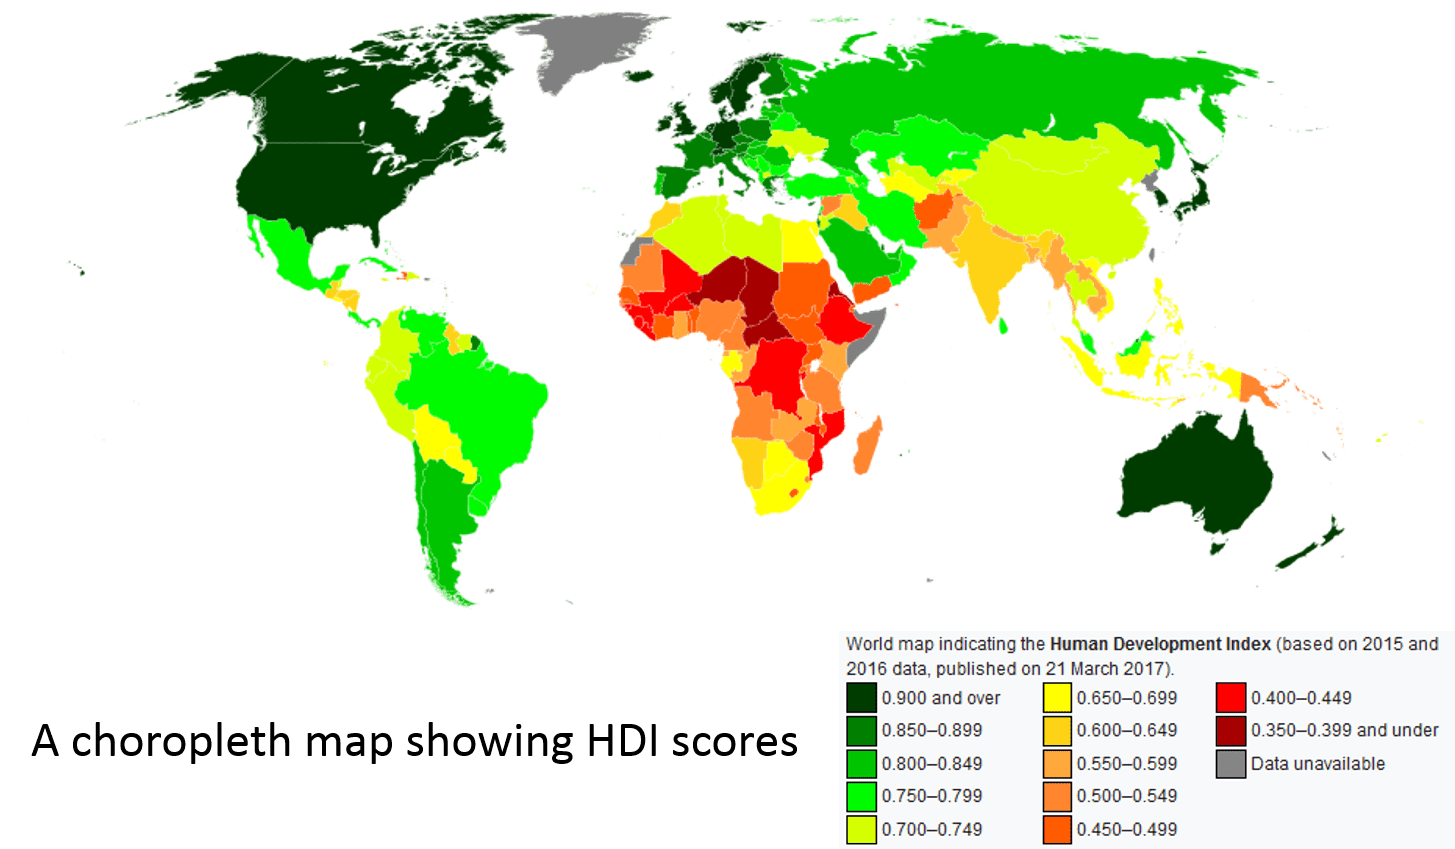
| Human Development Index (HDI) | a way of comparing the quality of life using three measures of development – life expectancy, education and wealth. |
The choropleth map below shows the different quality of life across the world – as measured by the Human Development Index (HDI)
![]()
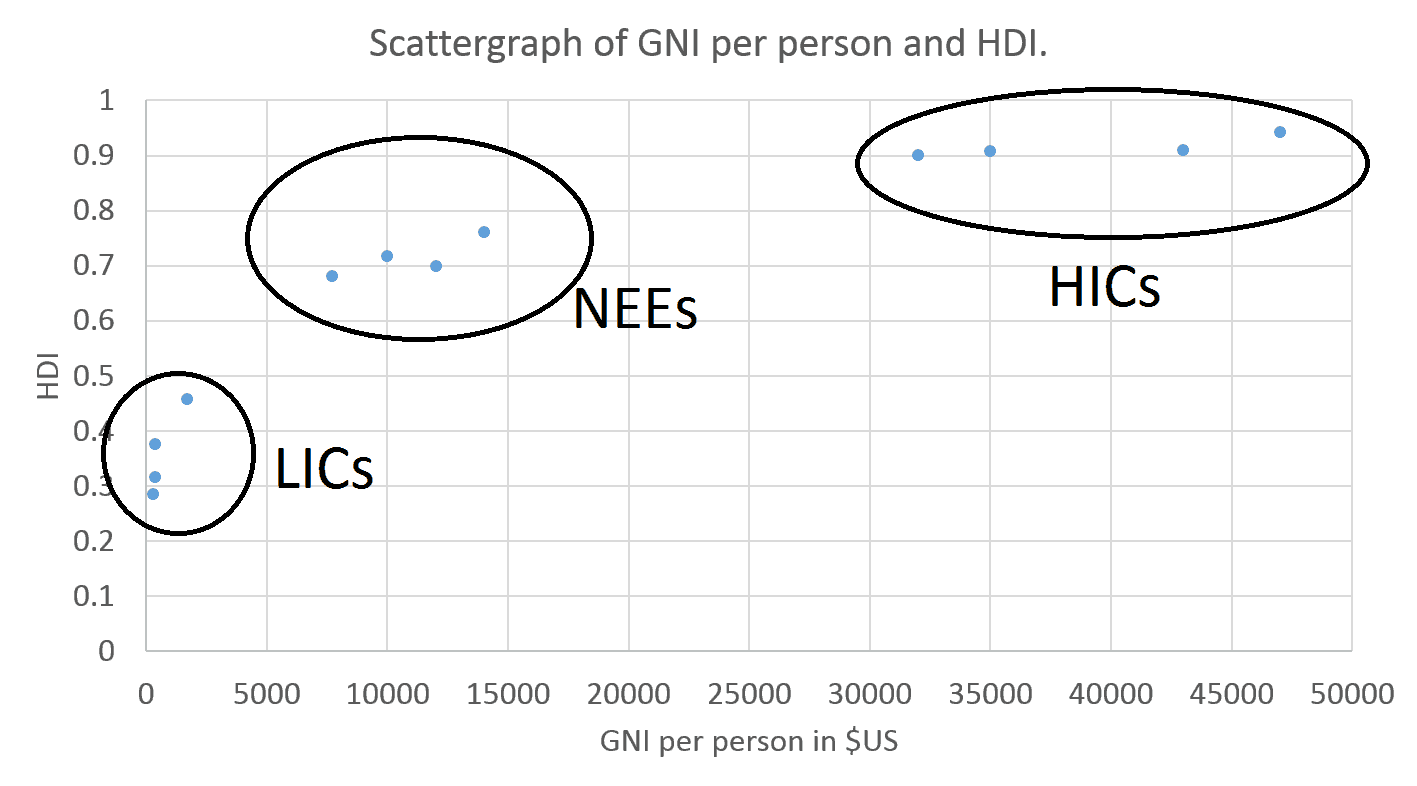
When you plot HDI against GNI (Gross National Income) per person you can see a positive correlation. In the top right of the graph you can see countries with a high GNI and high HDI. These are HICs. In the bottom left of the garph you can see countries with a low GNI and low HDI. These are LICs. In the middle are countries that are developing – getting richer. These are called Newly Emerging Economies (NEEs) or sometimes Middle Income Countries (MICs).
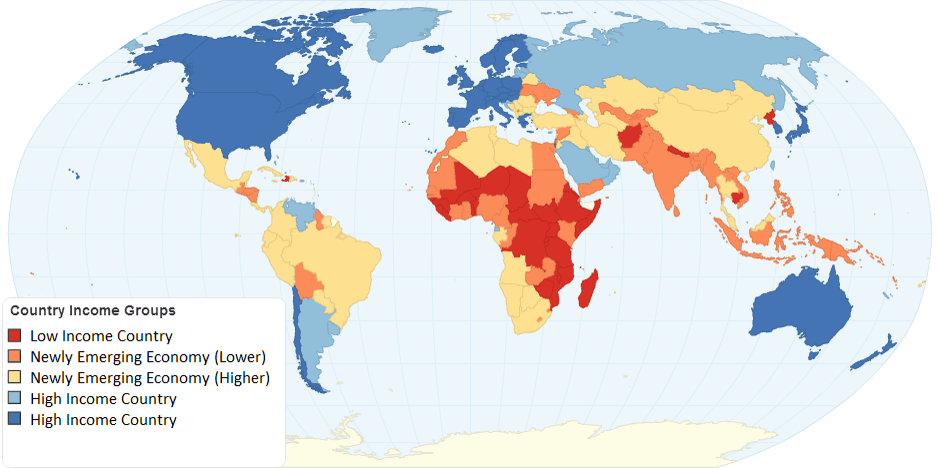
The map below the distribution of HICs, LICS and NEEs across the world.
You can also measure development using demographic information such as birth and death rates.
- Birth rate – the number of births per 1000 people per year
- Death rate – the number of deaths per 1000 people per year
- Rate of natural increase/decrease – the difference between births and deaths per 1000 people per year
| High birth rate | Low birth rate | High death rate | Low death rate |
| Need children to earn money for family
Poor access to contraception No pensions when you get old High infant mortality rate Religious beliefs |
Women having a job
Government rules Contraception available
|
Lack of healthcare
Lack of clean water Poor or no sanitation Famine (Food shortage) War Drought (Water shortage) |
Access to hospitals and medicines
Good harvest |
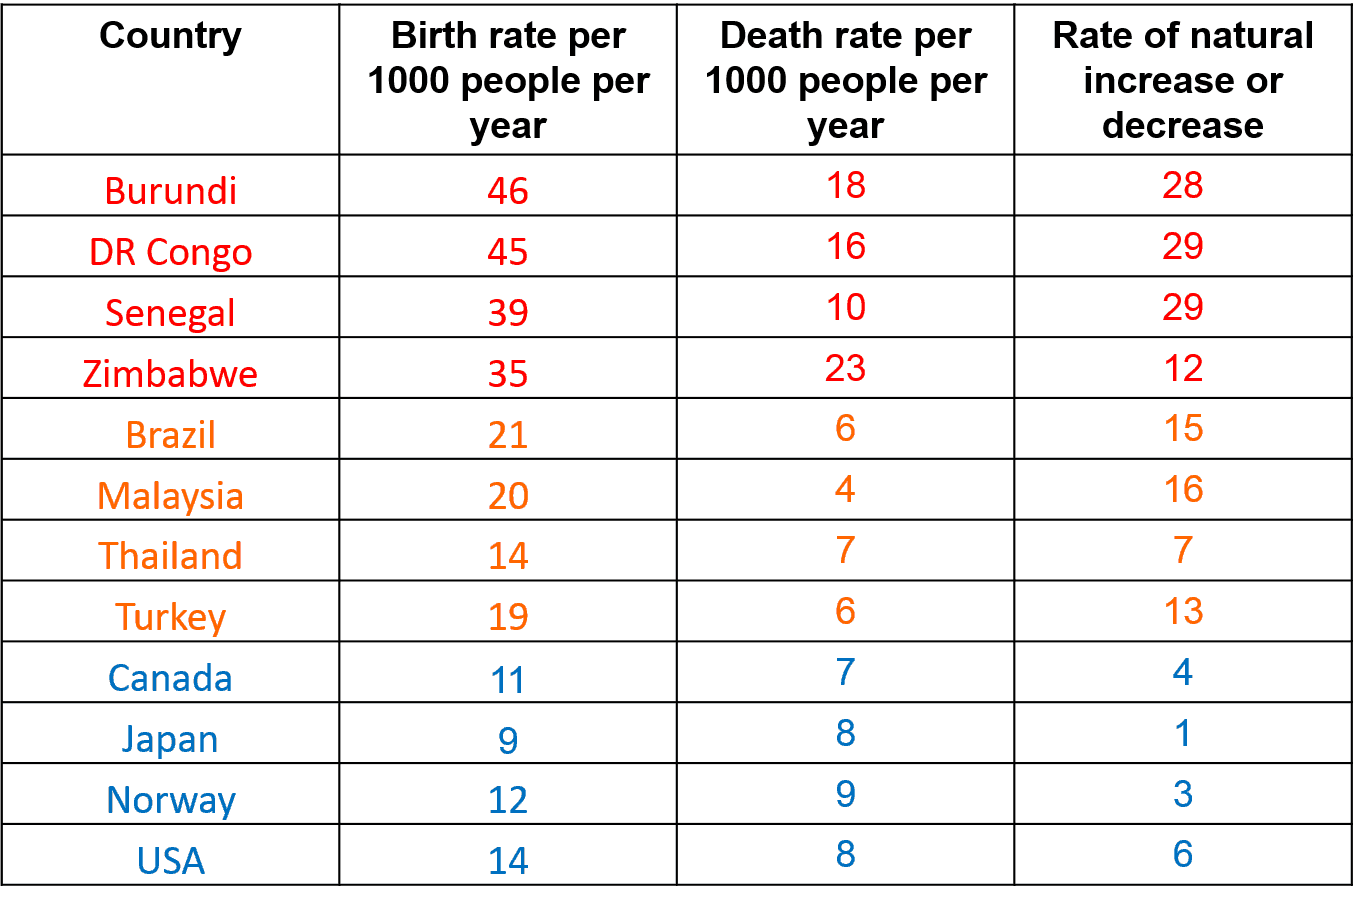
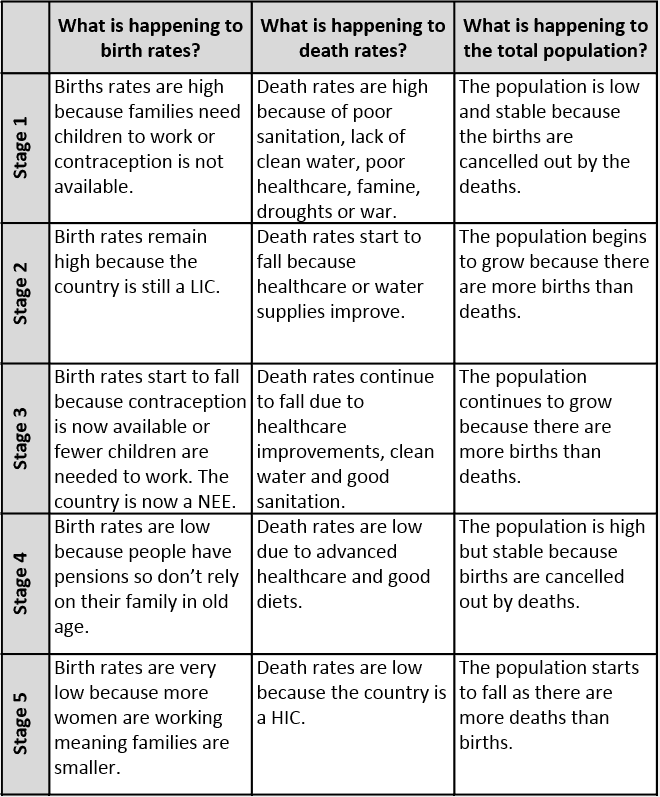
In this table you can see that LICs (red) have high birth rates, high death rates and high growth rates. HICs (blue) have low birth, death and growth rates. NEEs (orange) are in between. The way birth, death and growth rates change over time is shown in the Demographic Transition Model.

Another way of measuring development is to study the industrial structure.
- Primary – extracting raw materials from the ground or sea.
- Secondary – making something in a factory or workshop.
- Tertiary – providing a service.
- Quaternary – provides computing, communication and IT services
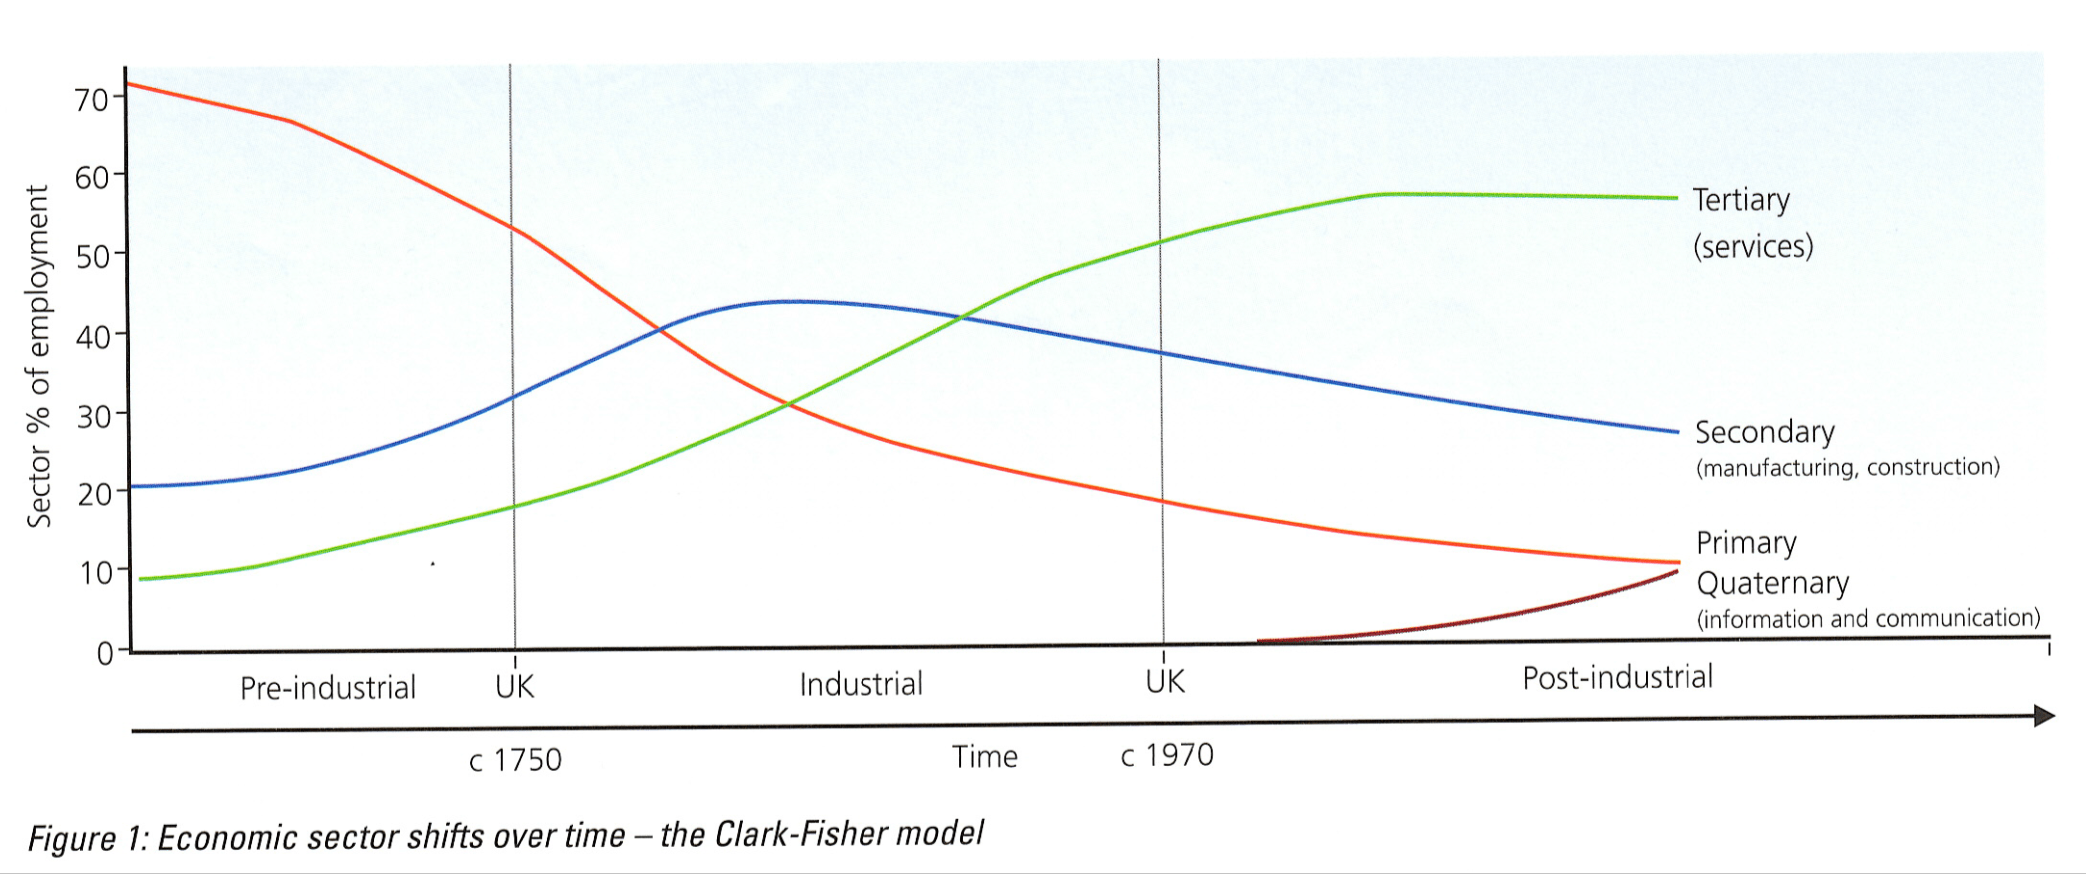
LICs generally have high levels of primary employment and low levels of secondary and tertiary. They are called pre-industrial countries. HICs have high levels of tertiary employment and very low levels of primary employment. They are called post-industrial countries. NEEs have growing levels of secondary and tertiary employment and declining primary sectors. They are called industrial countries.
However there are limitations when using social and economic measures of development.
| In LICs many people work in the informal sector so their work is not measured by GDP or GNI figures – which only record official goods and services. | It is difficult to compare GDP or GNI figures because $1 buys different amounts of goods in HICs compared to LICs. |
| In the UK a census is conducted every 10 years. The next will be in 2021. Data can be many years out of date. | In LICs many people work as subsistence farmers so the value of their crops is not measured. This food is eaten rather than sold or traded. |
| There may be different reading and writing standards across the world making literacy rates difficult to compare. | A population survey (called a census) is hard to conduct in a war zone or where there are many refugees. |
| Some people may lie in a census making data inaccurate, for example, if they are resident in a country illegally. | Some countries may lie about their GDP or GNI to make themselves look better than their neighbours or competitors. |
| Development indices (such the HDI) can be affected by errors in the different data inputs in the final figure. | In LICs may births and deaths go unreported so data may be inaccurate. |
The development gap

Causes
Some countries may be poorer than others because:
- they maybe landlocked with no coastline for trade.
- they may be at war which limits their development.
- they may lack natural resources such as oil, gas, coal or ores to sell.
- they may have a desert climate limiting agriculture.
- they may be affected by natural hazards such as earthquakes.
- they may be old colonies of European powers.
Effects
- Nearly half the world (3 billion people) live on less than £2 a day.
- The GDP of the 40 poorest countries (containing 600 million people) is less than the personal wealth of the world’s 7 richest people.
- One billion people in the world cannot read or write.
- Less than 1% of what is spent on weapons would send every child in the world to school.
- One billion children (1 child in 2) live in poverty.
- Swaziland in sub-Saharan Africa has the shortest life expectancy in the world at 38. The longest life expectancy is in Japan – more than double Swaziland’s at 83.
- 11 million children die before the age of 5 each year – 30 000 per day.
- In Tanzania, there are 50 000 people to each doctor. In Belgium, there are 220 people.
- Around the world 1 billion people defecate in the open. The highest percentage is in Eritrea in Africa where 77% have no sanitation.
- Bill Gates would be position number 90 when compared to countries’ wealth as measured by GDP.
- 15 million more migrants are likely to arrive in Europe from Africa by 2020.
- African migrants crossing the Mediterranean Sea mainly come from Somalia, Eritrea, Senegal, Ivory Coast, Nigeria, Guinea and The Gambia.
CASE STUDY
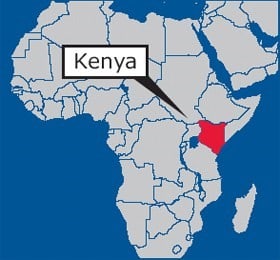 Kenya is in East Africa and is the biggest economy in east and central Africa. It has a GNI per person of US$ 1800 – ranked 156 out of 195 countries. It has a Human Development Index (HDI) of 0.519 – ranked 145 out of 195 countries. This puts Kenya in the upper part of the LIC group of countries. Kenya’s economy is growing at 7% a year so in the future it may become a NEE (newly emerging economy).
Context
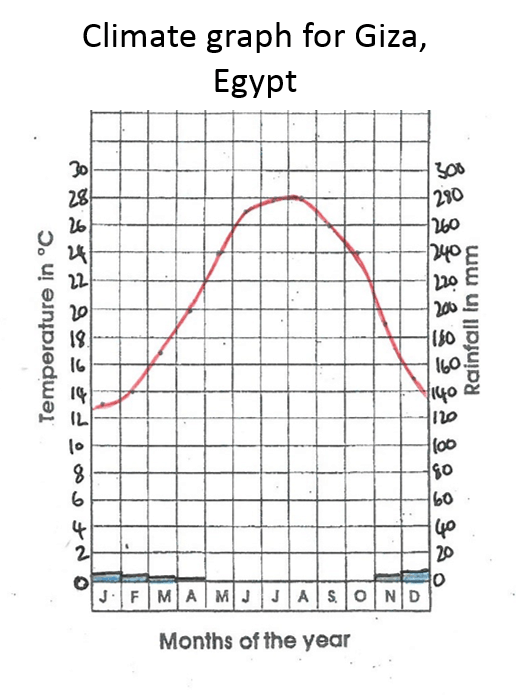
Kenya was once part of the British Empire. It gained independence in 1962. It is now a democracy. Kenya has a population of approximately 48 million. The birth rate is 35 births per 1000 people per year. The death rate is 8 per 1000 people per year. It has a rapidly growing population. It is in stage 2 of the Demographic Transition Model. There are over 70 different ethnic groups in Kenya. However, Swahili and English are the official languages. Kenya is situated on the equator. It is hot – typically over 200C. In the north, it is very dry, whereas the south is wetter. The main ecosystem is savanna grassland – home to lions, elephants, giraffes and zebras.
Industrial structure
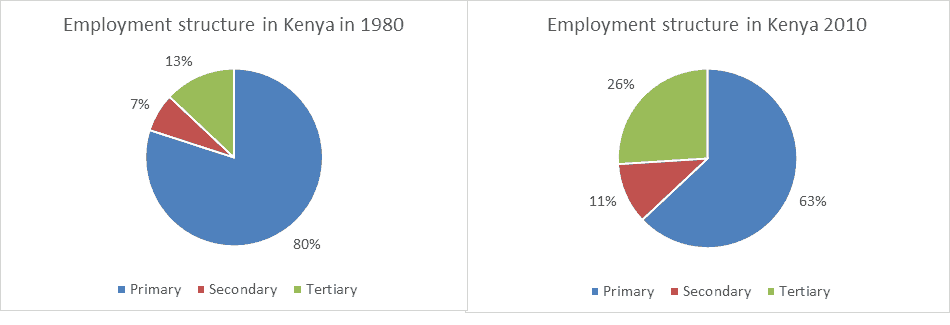
The employment structure has changed as Kenya has developed. Primary employment has declined but secondary and tertiary has grown. Kenya is still a pre-industrial economy but has moved closer to becoming a NEE.
The growth of the secondary sector has been accompanied by rapid urbanisation, especially in large cities such as Nairobi and Mombasa. The main secondary industries are linked to farming e.g. processing sugar cane, milling grain and brewing beer. Cement production is an important industry for the new roads, railways and pipelines under construction. Manufacturing is growing in importance e.g. trucks are built from imported kits to be sold in East Africa. The tertiary sector is even more important. Tourism is the biggest industry in Kenya, contributing 20% of the country’s GDP. Kenya also has an important telecommunications industry – Safaricom, a mobile phone operator, is one of Africa’s most profitable companies.
Transnational companies
 Unilever is an example of a transnational company (TNC)
It produces tea and sells it under many different brands.
Unilever is a transnational company (TNC) that grows tea in Kenya. This tea is sold as Brooke Bond, Lipton’s or PG Tips. Unilever is Kenya’s largest employer with 20 000 workers. It owns 16,000 acres and 20 tea estates. The company provides workers with pay above a typical agricultural worker – over double the minimum wage in Kenya. Unilever also offers housing, holiday pay, paternity and maternity leave, free health care, nursery and primary school education, clean drinking water and free meals during working hours. Recently Unilever invested £100 million in a new tea processing factory, which will employ hundreds of people and boost exports when completed.
However, new mechanized tea picking machines means many workers are being made redundant. This has reduced the number of workers in tea companies by half. There have been many protests about the control of large foreign owned tea growing companies. Some people want these TNCs to lose their lease on the land so that the tea estates can be taken over and run by local people. The Kenyan government have taken Unilever to court over unpaid taxes. They allege that the company owes £18 million. Trade unions claim TNCs exploit their employees. There have been allegations of sexual harassment of women, child labour and poor living conditions on foreign owned tea plantations.
Tourism
In 2016 there were 1.2 million tourists to Kenya. They spent £650 million directly in the economy. This is an average spend of £540 per tourist. Tourism creates 500 000 jobs in tertiary sector e.g. hotels and safaris. Tourism creates other jobs in the secondary and primary sectors too as tourists and businesses buy other goods and services. This is called the multiplier effect. This means tourism is worth 3 X £650 million = £1.95 billion per year. Tourism is important for Kenya and accounts for 20% of the country’s GDP. Therefore, tourism helps Kenya develop and close the development gap.
Multiplier effect = how the value of spending is multiplied throughout an economy as goods are bought and sold leading to an increase in GDP.
Strategies to reduce the development gap
There are a range of different strategies available to help Kenya develop. Some are ‘top down’ strategies which are often large and expensive. Decisions are made by governments with little involvement by local people. ‘Bottom up’ schemes are often smaller and cheaper and are planned and controlled by local people.
| Kenya receives the 10th most aid of any country in the world. The UK gives £600 million per year to Kenya and this is spent this on many social projects, including reducing the number of maternal deaths following child birth and improving conception advice and availability in rural Kenya. |
| Kenya’s debt is 52% of GDP – 14th most indebted in Africa. It does not yet qualify as a HIPC (Heavily Indebted Poor Country). Its neighbours, Tanzania, Uganda and Ethiopia do and the International Monetary Fund and the World Bank has paid off part of their debt. This means that these LICs have more money to spend on themselves, rather than repaying their debt. |
| Kenya became one of the largest recipients of foreign investment in Africa. It has increased since 2010 with investment from China in railways, ports and mines. A £2.5 billion railway has been built with Chinese investment linking Nairobi to Mombasa on the coast. This will increase Kenyan exports and trade. |
| Kenya supplies the Co-operative supermarket with fair trade tea. The tea is grown by Kenyan farmers and Kenyan owned businesses. Payment for these sales includes the additional fair trade premium of 50p/kg to invest in business improvements and community development. The extra money goes towards providing health clinics for local people and scholarships for children to attend schools and colleges. |
| Non-governmental organisations (NGOs) such as charities supply intermediate technology to LICs. For example, charities have provided the money to build sand dams and wells in Kenya to improve the water supply. Solar cookers and solar panels for lighting have also been provided for the poorest communities. These simple, low tech ideas improve lives for local people. |
| Microfinance offers small loans – as lows a £10 – for people to start or expand businesses. For example, the Kenyan Women Microfinance Bank could make a small loan to woman to set up a road side stall. The loan can be repaid when the stock is sold and the profits from the sales re-invested in more stock and a growing business. |
| The main exports from Kenya are tea, cut flowers, coffee and vegetables. Kenya’s main markets for these goods are the UK, Netherlands and USA. Kenya earns US$ 3.2 billion from exports. This trade creates jobs and helps the country to develop via the multiplier effect. |
| Kenya is a member of the EAC – East African Community – and COMESA – Common Market for Eastern and Southern Africa. These organisations aim to improve trade by reducing rules, regulations and taxes on imports and exports between countries in the region. This will increase trade and create jobs. |
Effects of development
Economic development in Kenya has created several environmental problems.
Air pollution is a problem in Nairobi – Kenya’s capital city. A rapid increase in the number of vehicles and increasing amounts of industry has created air pollution. It can be 30 times as bad as London’s. This is having knock on effects on people’s health.
Water shortages are also affecting Nairobi. A rapidly growing urban population and increasing water consumption by industry has created water shortages. Water rationing has been introduced and many people buy water from street traders for 50p for a 20 litre container.
However, economic development has also created social and economic benefits.
| 1990 | 2015 | |
| Life expectancy | 52 years | 62 years |
| GNI per person | US$ 1470 | US$ 2990 |
| People per doctor | 20 000 | 7000 |
| Infant mortality | 66 deaths per 1000 | 35 deaths per 1000 |
| Literacy rate | 60% | 72% |
| HDI | 0.473 | 0.555 |
This table shows that people in Kenya are wealthier and healthier, living longer with better education and a higher quality of life.